Close window
PREMIUM
- Support Cudasteam
- No Ads
-
-
1-week Premium 200 Cuda Coins$4.99
-
1-month Premium 350 Cuda Coins$9.99
-
3-month Premium 500 Cuda Coins$6 / month 40% discount
-
12-month Premium 1000 Cuda Coins$4 / month 60% discount
Continue -
Compare
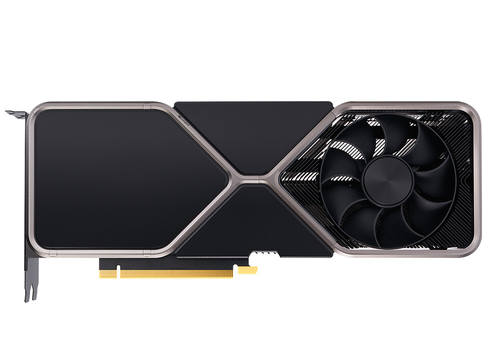
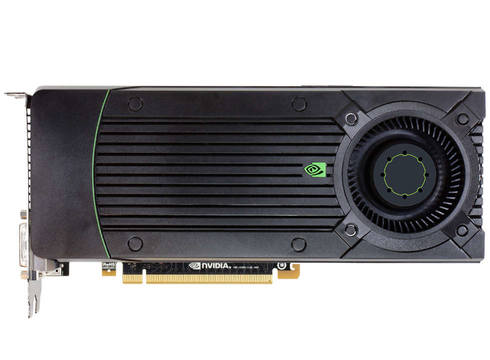
Nvidia RTX 2080 SUPER 8GB 15Gbps 256-bit 250W Desktop Graphic card Nvidia GameRock 1080 8GB 10Gbps 256-bit 180W Desktop Graphic card
3.6/10
Score
4176

3.4/10
Score
3989

$
720
$
600
Share with friends
Copy link
GPU ArchitectureShading UnitsGPU ClockGPU Boost ClockMemory CapacityMemory TypeMemory SpeedMemory Bus WidthMemory BandwidthTexture Mapping Unit (TMU)Render Output Unit (ROP)Pixel Fill RateTexture Fill RateFloating Point Per SecondDirectXOpenGLMax GPU TempratureGraphics Card PowerRise of the Tomb RaiderShadow of the Tomb RaiderThe Witcher 3Metro ExodusBattlefield 1Far Cry 5Assassin's Creed UnityResident Evil 2
Visual view
Simple view
GPU Architecture
The smaller GPU, the better performance
12 nm
16 nm
Shading Units
The more Cores, the faster data are processed by the GPU
3072
2560
GPU Clock
The higher the clock, the more instructions the GPU can execute per second
1650 MHz
5% higher
1746 MHz
GPU Boost Clock
The Boost clock helps GPU to get more performance
1815 MHz
4% higher
1885 MHz
Memory Capacity
The VRAM capacity is used most for Anti Aliasing, Textures and Screen resolution
8 GB
8 GB
Memory Type
GDDR6
GDDR5X
Memory Speed
The faster Memory, the faster Read/Write operations of the data
33% higher
15 Gbps
10 Gbps
Memory Bus Width
The Wider Memory Bus, the more data can flow without waiting
256 bit
256 bit
Memory Bandwidth
The more bandwidth, the faster data transfers between GPU and VRAM
35% higher
495 GB/s
320 GB/s
Texture Mapping Unit (TMU)
The more Texture Mapping Units, the faster Texture Fill Rate
192
160
Render Output Unit (ROP)
The more Rander Output Units, the faster Pixel Fill Rate
64
64
Pixel Fill Rate
Indicates how many Pixels GPU can draw per second
116 GP/s
4% higher
121 GP/s
Texture Fill Rate
Indicates how many Textures can be mapped per second
13% higher
349 GT/s
302 GT/s
Floating Point Per Second
The more Floating Point Operations per second the better performance of the GPU
11 Flop/s
10 Flop/s
DirectX
12
12
OpenGL
5
5
Max GPU Temprature
The maximum GPU temprature allowed by manufacturer
192 °F
201 °F
Graphics Card Power
Typical power consumption of the graphic card board
250 Watts
28% lower
180 Watts
Rise of the Tomb Raider
Settings Max, 1440p
18% higher
114 fps
93 fps
Shadow of the Tomb Raider
Settings Max, 1440p
32% higher
96 fps
65 fps
The Witcher 3
Settings Max, 1440p
15% higher
112 fps
95 fps
Metro Exodus
Settings Max, 1440p
20% higher
122 fps
98 fps
Battlefield 1
Settings Max, 1440p
31% higher
147 fps
102 fps
Far Cry 5
Settings Max, 1440p
25% higher
111 fps
83 fps
Assassin's Creed Unity
Settings Max, 1440p
27% higher
92 fps
67 fps
Resident Evil 2
Settings Max, 1440p
11% higher
103 fps
92 fps
Recommended

3.6/10
Score
4176

Add to Favorite
Nvidia RTX 2080 SUPER 8GB 15Gbps 256-bit 250W Desktop Graphic card
PROS 15
| GPU Architecture | 12 nm vs 16 nm | GPU architecture size is (4nm) 25% smaller |
|---|---|---|
| Shading Units | 3072 vs 2560 | (512) 17% more Shader Processing Units |
| Memory Speed | 15 Gbps vs 10 Gbps | Transfer speed of the memory is (5Gbps) 33% faster |
| Memory Bandwidth | 495 GB/s vs 320 GB/s | Memory bandwidth is (175GB/s) 35% faster |
| Texture Mapping Unit (TMU) | 192 vs 160 | (32) 17% more Texture Mapping Units |
| Texture Fill Rate | 349 GT/s vs 302 GT/s | Texel Fill Rate is (47GT/s) 13% faster |
| Floating Point Per Second | 11 Flop/s vs 10 Flop/s | (1Flop/s) 9% more Floating Point Operations per minute |
| Rise of the Tomb Raider | 114 fps vs 93 fps | Rise of the Tomb Raider - 1440p: (21fps) 18% more frames per second |
| Shadow of the Tomb Raider | 96 fps vs 65 fps | Shadow of the Tomb Raider - 1440p: (31fps) 32% more frames per second |
| The Witcher 3 | 112 fps vs 95 fps | The Witcher 3 - 1440p: (17fps) 15% more frames per second |
| Metro Exodus | 122 fps vs 98 fps | Metro Exodus - 1440p: (24fps) 20% more frames per second |
| Battlefield 1 | 147 fps vs 102 fps | Battlefield 1 - 1440p: (45fps) 31% more frames per second |
| Far Cry 5 | 111 fps vs 83 fps | Far Cry 5 - 1440p: (28fps) 25% more frames per second |
| Assassin's Creed Unity | 92 fps vs 67 fps | Assassin's Creed Unity - 1440p: (25fps) 27% more frames per second |
| Resident Evil 2 | 103 fps vs 92 fps | Resident Evil 2 - 1440p: (11fps) 11% more frames per second |
CONS 4
| GPU Clock | 1650 MHz vs 1746 MHz | Clock speed is (96MHz) 5% lower |
|---|---|---|
| GPU Boost Clock | 1815 MHz vs 1885 MHz | Boost clock speed is (70MHz) 4% lower |
| Pixel Fill Rate | 116 GP/s vs 121 GP/s | Pixel Fill Rate is (5GP/s) 4% slower |
| Graphics Card Power | 250 Watts vs 180 Watts | Power consumption is (70Watts) 28% higher |
2nd Choice

3.4/10
Score
3989

Add to Favorite
Nvidia GameRock 1080 8GB 10Gbps 256-bit 180W Desktop Graphic card
You might also like
Scroll/Slide to the left or to the right side
-

-
 3.6/10Score 4209
Nvidia GTX TITAN X 12GB 10Gbps 384-bit 250W Desktop Graphic card
$1490Where to buy? -

-
 3.6/10Score 4143
Nvidia GTX 1080 Ti 11GB 10Gbps 352-bit 250W Desktop Graphic card
$700Where to buy? -

-

-
 3.4/10Score 3989
Nvidia GameRock 1080 8GB 10Gbps 256-bit 180W Desktop Graphic card
$600Where to buy? -
 3.4/10Score 3973
Nvidia RTX 2070 SUPER 8GB 14Gbps 256-bit 215W Desktop Graphic card
$680Where to buy? -
 3.4/10Score 3898
Nvidia Rog Strix 1080 8GB 10Gbps 256-bit 180W Desktop Graphic card
$600Where to buy? -
 3.3/10Score 3852
Nvidia Windforce 1080 8GB 10Gbps 256-bit 180W Desktop Graphic card
$600Where to buy?
More comparisons
Nvidia RTX 2080 SUPER


Radeon R9 270

vs

Nvidia RTX 2080 SUPER


Nvidia EVGA GTX 1070

vs

Nvidia RTX 2080 SUPER


Radeon R9 290

vs

Nvidia RTX 2080 SUPER


Nvidia RTX 2080 Ti

vs

Nvidia RTX 2080 SUPER


Nvidia GTX 750

vs

Nvidia RTX 2080 SUPER


Nvidia Matrix 980 Ti

vs

Nvidia RTX 2080 SUPER


Nvidia GTX 750 Ti

vs

Nvidia RTX 2080 SUPER


AMD RX 5700 XT

vs

Nvidia RTX 2080 SUPER


AMD RX Vega 64

vs

Nvidia RTX 2080 SUPER


Nvidia Palit Dual 1060

vs

